Corvus — Passer Configuration Utility
Corvus (Passer Programming Tool) is a client application for connecting to Passer-V2, Passer-T2, and Passer-Sch devices via Ethernet. It allows you to configure network and local parameters, calibrate registers responsible for device functionality, and collect and visualize data from tachometric inputs.
After writing changes, devices automatically apply them and restart with the updated configuration.
| Parameter | Value |
|---|---|
| Version | 1.78 (dated 28.01.2026) |
| Compatibility | Passer-V2, Passer-T2, Passer-Sch |
| OS | Windows 7+ (x64) |
| Connection | Ethernet (Modbus TCP, port 502) |
System Requirements
- Windows 7 (x64) or higher
- External Ethernet port
- At least 8 GB RAM
- Graphics processor or video card for UI rendering
Getting Started
Connecting to a Device
- Connect the device to a 24 V DC, 0.4 A power source.
- Configure the PC network connection: static IP —
192.168.0.1, subnet mask —255.255.255.0. - Connect the device to the PC with an Ethernet cable.
- Launch
Corvus.exefrom the provided archive. - In the IP field, enter the device address —
192.168.0.100(default) and click Connect.
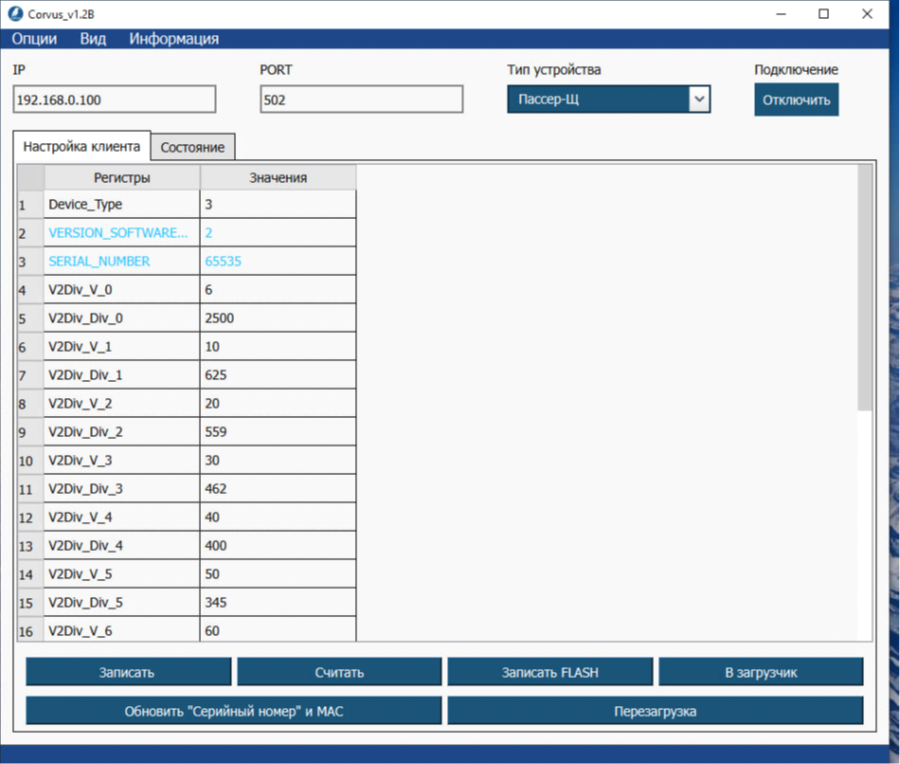
- Click Read — the table will display data from network parameter and calibration coefficient registers.
- Set the desired values in the second column of the table.
- Click Write — a success message appears in the bottom left.
- To save parameters to the device: click Write to FLASH, then Reboot.
Wait 5–10 seconds between clicking Write FLASH and Go to Bootloader.
Network Configuration
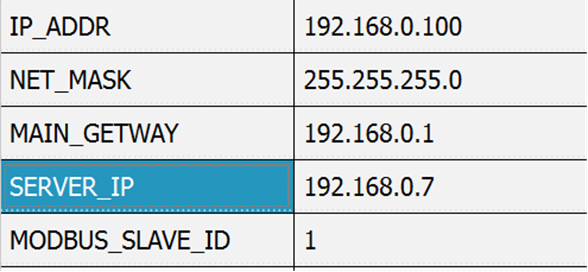
Open the Client Settings tab and set register values according to your requirements:
IP_ADDR— device IP addressNET_MASK— subnet maskMAIN_GETWAY— default gatewaySERVER_IP— data collection server IP
Checking Inputs and Outputs
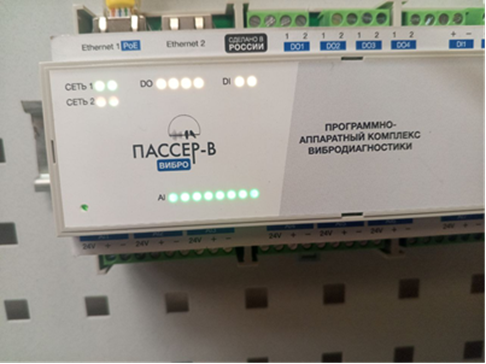
To check AI1–AI8 channels (Passer-V2) or U1–U3, I1–I3 (Passer-T2), write 1 to registers CH1_AI_Enable – CH8_AI_Enable and click Write.

After writing, the AI LEDs on the front panel will turn green, indicating channel activation.
Open the Status tab to monitor AI/DO/DI channels. Without connected sensors, DO values will appear yellow. If a DO LED turns blue — a threshold value on a channel has been exceeded; the device requires inspection.
Sections "Firmware Update" and "Calibration" are available in the developer documentation. Authorization required.
Tachometric Data Collection
To work with tachometric inputs DI1–DI2:
- Open the Status tab, find registers
CH1_DI_ENABLEandCH2_DI_ENABLE, write value 1.

- Open the Tachometric Collection tab.
- Select channels DI 1 and/or DI 2.
- To record to XLSX: enter the update frequency and click Start Recording, specify the file path.
- To stop recording, click Start Recording again.
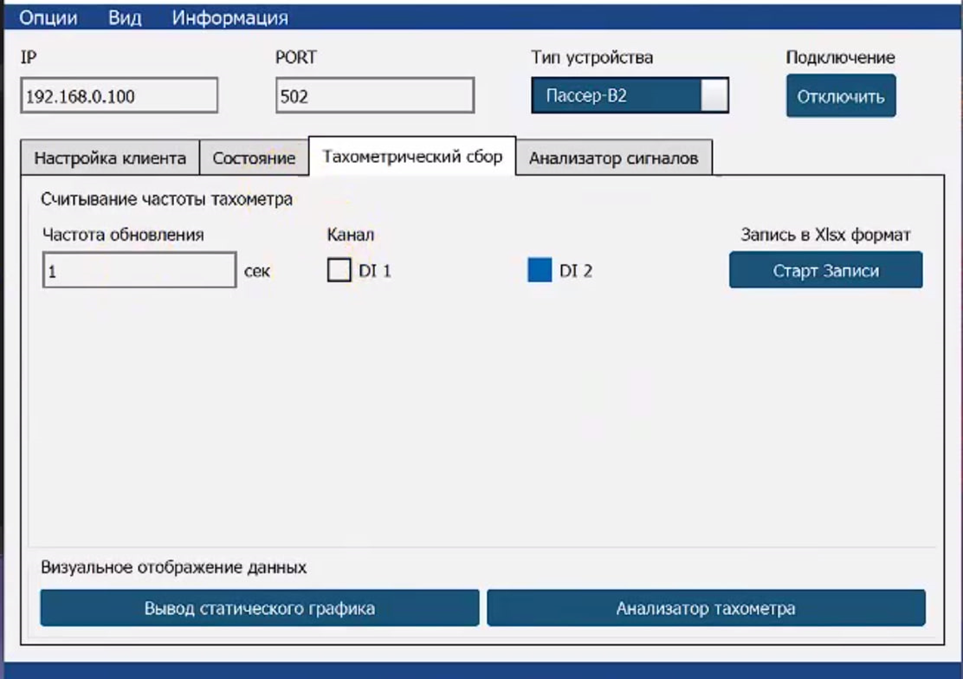
Data Visualization
- Static graph output — builds a graph from saved XLSX file data.
- Tachometer analyzer — displays real-time graphs from DI 1 and DI 2 for
CH_DI_FREQandCH_DI_Periodparameters.
Graph control panel:
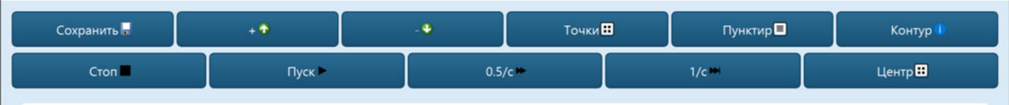
| Button | Purpose |
|---|---|
| Save | Save graph to file |
| Points | Point display mode |
| Dashed | Dashed line display |
| Contour | Dashed + points |
| Start/Stop | Graph update control |
| 0.5/1s | Update frequency |
| Center | Zoom to last 5 points |
Signal Analyzer
The Signal Analyzer tab is designed for real-time viewing of status channel data.
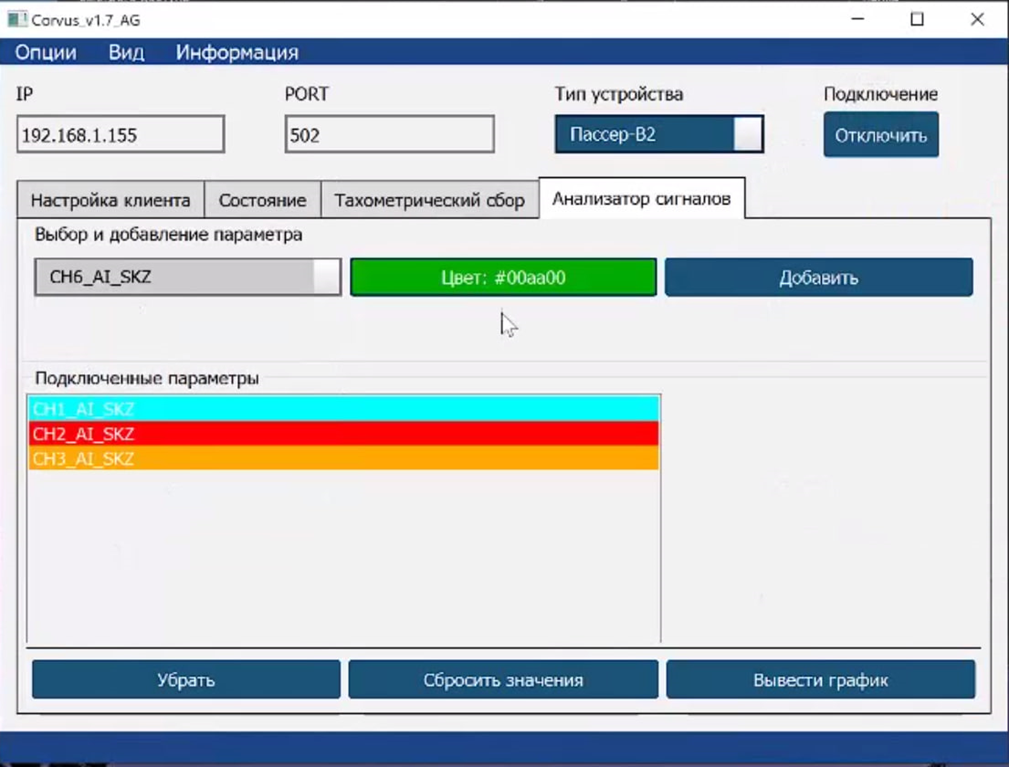
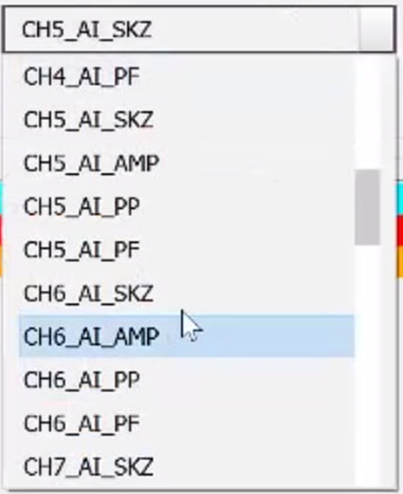
- Select a parameter from the list.
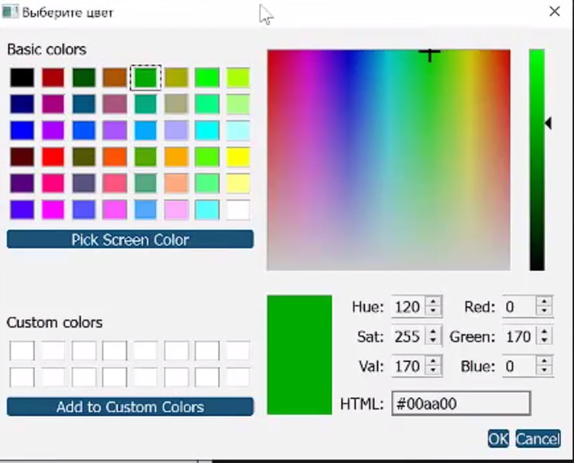
- Select the display color on the graph.
- Click Add — the parameter will appear in the "Connected Parameters" window.
- Click Show Graph to display data. Graph windows can be moved and combined.
Download
Download Corvus| File | Version | OS | Size | Format |
|---|---|---|---|---|
| Corvus_1.7.8_L.zip | 1.7.8 | Windows 7+ (x64) | 42.6 MB | ZIP |
Support
- Email: support@liman-tech.ru
- Website: www.liman-tech.ru